
Hi Marko, On 2025-01-09 07:19, Marko Mäkelä wrote:
On Wed, Jan 8, 2025 at 12:54 PM <kazuhiko@nexedi.com> wrote:
I could reproduce 'history list increase' issue with the attached schema and python script, that executes 50% R-C DML and 50% R-R DQL using 64 threads.
Thank you. I have asked our performance tester to reproduce this.
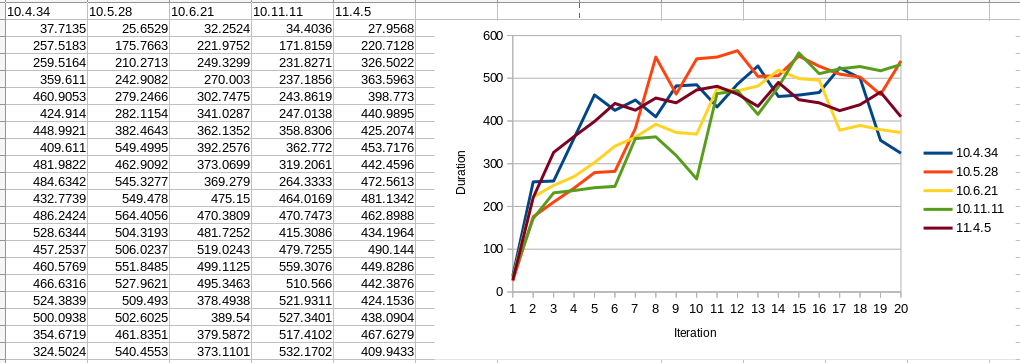
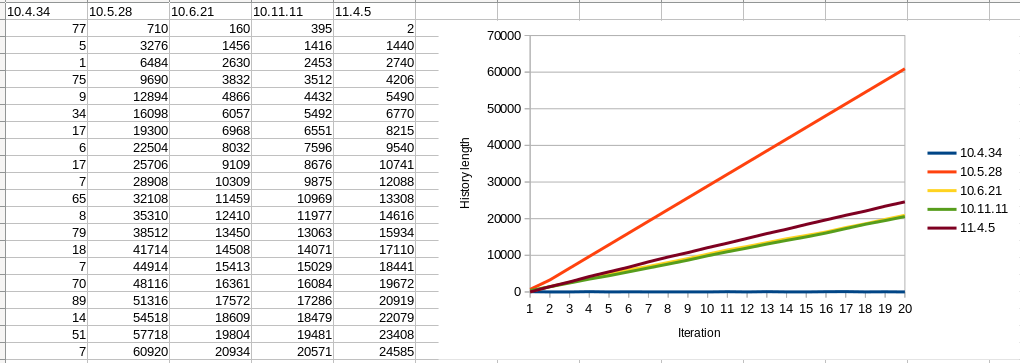
I ran this test on several latest MariaDB versions. As our real use case is much larger than possible physical RAM, I intentionally ran this test with the default innodb_buffer_pool_size, i.e. 128MB, so that data / index size will exceed the buffer size during the test. Thus [mysqld] section configuration is like : slow_query_log long_query_time = 1 innodb_flush_method = O_DIRECT histogram_size = 0 optimizer_use_condition_selectivity = 1 With MariaDB 10.4, history length is quite stable, always less than 100. For any version >= 10.5, it keeps growing even though we have no long running transactions. But with these '20 iteration' tests, the overall duration are not so different even with such higher history length. Can we assume that 'high history length without running long transaction' is harmless ? Another interesting result is 'slow query analysis'. We had slow (i.e.
= 1sec) queries not only in DML but also very simple DQL.
[DML] # Attribute pct total min max avg 95% stddev median # ============ === ======= ======= ======= ======= ======= ======= ======= # Exec time 99 250125s 1s 14s 4s 6s 1s 3s (10.4.34) # Exec time 99 228618s 1s 89s 4s 7s 2s 4s (10.5.28) # Exec time 99 204810s 1s 11s 3s 6s 1s 3s (10.6.21) # Exec time 99 207643s 1s 10s 3s 6s 1s 3s (10.11.11) # Exec time 99 224214s 1s 10s 4s 6s 1s 4s (11.4.5) [DQL] # Attribute pct total min max avg 95% stddev median # ============ === ======= ======= ======= ======= ======= ======= ======= # Exec time 0 1352s 1s 3s 1s 2s 212ms 1s (10.4.34) # Exec time 0 1022s 1s 46s 3s 9s 4s 1s (10.5.28) # Exec time 0 30s 1s 1s 1s 1s 60ms 1s (10.6.21) # Exec time 0 140s 1s 1s 1s 1s 51ms 1s (10.11.11) # Exec time 0 58s 1s 1s 1s 1s 85ms 1s (11.4.5) Here, 10.5.28 is really horrible. It took 46s at maximum with a simple DQL using the primary key. But in my test workload with prod-like data, I had 'several seconds freeze' on 10.11 and 11.4 as well, that cannot be reproduced with this simple test unfortunately. If you have any idea to suppress or investigate 'freeze' issue, it would be very appreciated! For now I don't know the reason behind, like freeing undo log ? writing buffer to storage ? or anything else ?
For what it is worth, for quite some time we have observed a huge history list length during certain Sysbench workloads. The problem was significantly improved for some workloads by some changes such as MDEV-32050. One surprise was that under some circumstances, the purge tasks could steal too many resources from SQL processing. The actual "fix" of https://jira.mariadb.org/browse/MDEV-34515 was to limit the default size of a purge batch to 127, to match the number of usable rollback segments when using innodb_undo_tablespaces>1. Roughly speaking, InnoDB can concurrently start or commit at most that many transactions. If the purge batch is larger, it appears to block the starting or finishing of user transactions. I made several other improvements based on my observations while diagnosing MDEV-34515, but in the end it was the configuration parameter change that "fixed" that artificial test case (a table with 1 record and 1 secondary index).
Setting innodb_purge_batch_size to 300 (the old default value) did not change this test result, at least on 11.4.5, i.e. history length still keeps growing. Best regards, Kazuhiko